Context: 2022-11
Leveraging investments multiplies the risk of loss as well as the potential for gain. I generally would only consider it for highly secure debt investments, or the special case of an equity bull market following a major market crash. In that case, I would consider using funds in the Morningstar category of Trading-Leveraged Equity, as they perform well when the market trends in one direction, which can reasonably be expected because of the economic-recovery and valuation-normalization which occur during such a bull market.
Caveats:
I would only condsider investment in a Trading-Leveraged Equity fund under specific conditions:- during a bull market following a major market crash
- with a nominal 2x leverage, or less
- with a major broad index such as the S&P 500
- with a highly liquid fund
- with a stop-loss approach to limiting drawdowns, as detailed herein
- when entry at the estimated market bottom uses the underlying index (without leverage), due to volatility spikes near major market bottoms
Morningstar defines category of Trading-Leveraged Equity:
These funds seek to generate returns equal to a fixed multiple of the short-term returns of an equity index. The compounding of short-term returns results in performance that does not correspond to those of investing in the index with external leverage. For example, a fund attempting to achieve 2 times the returns of a given index on a daily basis is unlikely to deliver anything like 2 times the index’s returns over periods longer than one day. Many of these funds seek to generate a multiple of the daily or weekly return of the reference index. Trading funds are not considered suitable for a long-term investor and are designed to be used by active traders.I didn't find the statement that such funds are
unlikely to deliver anything like 2 times the index’s returns over periods longer than one day, to be strictly true. The difference has to do with the persistence of the direction of the market, as described below.
| Return Scenario (10 days) | Case A ($100 + $100 Loan) | Case B ($100 + $0 Loan) | Equity (B-A) | |||||
|---|---|---|---|---|---|---|---|---|
| Initial Value | Factor | Value | Equity | Initial | Factor | Equity | ||
| Const +1% | $200.00 | 1.1046 | $220.92 | $120.92 | $100.00 | 1.2190 | $121.90 | $0.98 |
| Const -1% | $200.00 | 0.9044 | $180.88 | $80.88 | $100.00 | 0.8171 | $81.71 | $0.83 |
| Alt -1% / +(100/99)% | $200.00 | 1.0000 | $200.00 | $100.00 | $100.00 | 0.9990 | $99.90 | -$0.10 |
| Alt -10% / +(100/90)% | $200.00 | 1.0000 | $200.00 | $100.00 | $100.00 | 0.8937 | $89.37 | -$10.63 |
The difference between these funds and just taking out a loan to buy extra shares of a security, is in the mathematics, which involve an Initial value multiplied buy a Factor. In the Loan case, the loan is added to the Initial value, and the Factor is the product of (1+Ri) for each day i and return Ri. For the Trading-Leveraged Equity (TLE) case, there is no loan, and the Factor is product of (1+2Ri) for each day i and return Ri. In the adjacent table, both of these are tabulated for constant returns and for returns of alternating signs on successive days so that the peaks and valleys are constant. Note that the TLE fund does slightly better for the cases of constant return, either negative or positive, but does worse for the oscillating value scenario. Also, note that the discrepancy increases drastically for the 10% case, over the 1% case. This neglects any fund expenses or loan expenses, but since the fund expenses are only around 1% and margin loan rates are around 12%, this is a positive for the TLE funds.
Performance In Bull and Bear Phases of Major Market Crashes
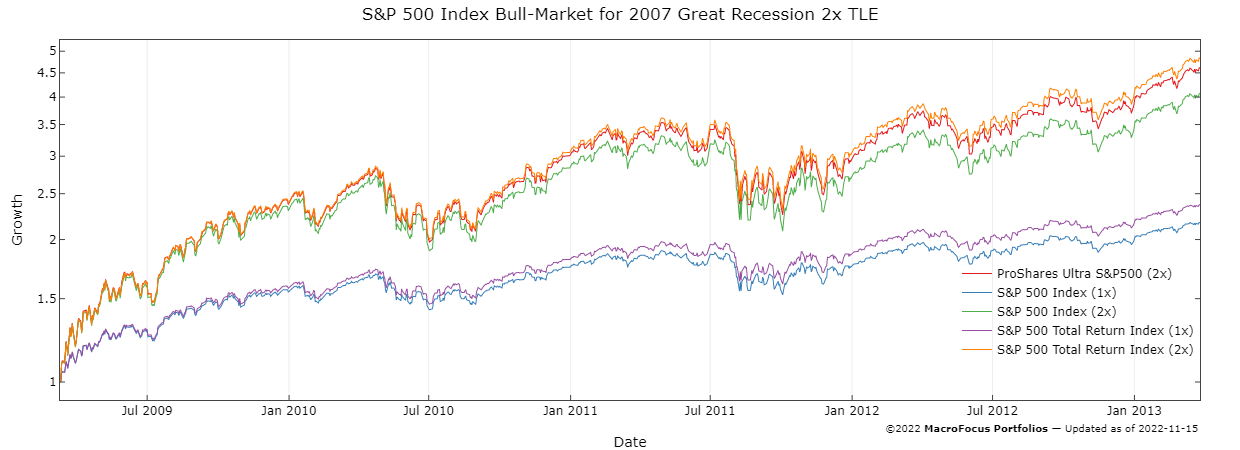
Performance will be evaluated for the S&P 500 Index, a broad large-cap index with relatively low volatility, and the Nasdaq 100 Index, a less-broad large-cap index with somewhat higher volatility. Performance will be evaluated only for major bull markets, where returns will be largely positive and persistent. Adjacent is an example of the ProShares Ultra S&P500 (SSO) for the bull-market phase of the 2007 Great Recession (click image for interactive full-width image) which offers 2x daily leverage on the S&P 500 Index (does not include dividends). In that bull market, the ProShares Ultra S&P500 (2x), averaged 1.96x, exceeding the theoretical 2x S&P 500 Index, which averaged 1.82x. It also came close to the theoretical 2x (average 1.82x) of the S&P 500 Total Return Index, averaging 1.76x on a daily basis. All of the 2x theoretical results are calculated using the above formulas which match the actual ProShares Ultra S&P500 fund fairly well.
Below are investment results for past cases, using the longest running 2X funds available, and the exact peaks and troughs of the underlying indices. This is not possible for any future events, but the results are useful in evaluating the concept (click leverage value for interactive full-width image)
| Fund↓ Major Crash→ | 2007 Great Recession | 2020 COVID-19 Recession | 2022 Stock Market Decline | |||||||||
|---|---|---|---|---|---|---|---|---|---|---|---|---|
| Bear Market | Bull Market | Bear Market | Bull Market | Bear Market | Bull Market | |||||||
| Lvg | Growth | Lvg | Growth | Lvg | Growth | Lvg | Growth | Lvg | Growth | Lvg | Growth | |
| ProShares Ultra S&P500 | 2.23 | -85% | 1.97 | +354% | 2.15 | -59% | 1.94 | +87% | 2.15 | -47% | 1.89 | +16% |
| ProShares Ultra QQQ | 2.26 | -82% | 1.81 | +266% | 2.20 | -51% | 1.91 | +83% | 2.24 | -62% | 1.78 | +10% |